
Automation & AIOps ROI Lens
Measure the operation. Understand what automation and AI are actually delivering.
- Who it is for: CIO, CTO, Operations leadership, Automation and AIOps teams, and the CFO.
- The question it answers: What is automation and AI actually delivering across the operation, and where is the ROI?
How you onboard the use case
Section titled “How you onboard the use case”You onboard the Automation & AIOps ROI Lens by modeling automation as an asset, connecting it to the technology model, ingesting operational data, measuring it, and mapping it to Service Offerings.
1. Define Automation as an asset
Section titled “1. Define Automation as an asset”Define the Automation Asset Type on its Service in the Technology model, with the attributes needed to understand and measure each automation. Each automation you track is then an Asset in Inventory.
2. Connect automation to the technology model
Section titled “2. Connect automation to the technology model”The automation uses the technology stack already defined in 7lens, showing where automation sits within the real technology and service architecture.
3. Ingest operational data
Section titled “3. Ingest operational data”Connect existing ticketing, support, operational, automation and AI-agent platforms to understand actual executions and demand.
4. Measure automation
Section titled “4. Measure automation”For each service or demand, understand whether it is automated, partially automated or manual, along with execution volume, execution time, automation SLA, success rate, lead time, resolution time, Mean Time to Resolve and Mean Time to Recover.
5. Map automation to Service Offerings
Section titled “5. Map automation to Service Offerings”Tickets, automations and AI agents all map to Service Offerings, so 7lens understands demand, service, technology, automation and AI rather than treating systems independently.
6. Build a Lens
Section titled “6. Build a Lens”Once the 7lens Ontology is onboarded, configure the Lens on top of your existing Context: the attributes, relationships, mappings, and context this reading needs. You do not start from scratch, because the Ontology and the Context are already there. The seven named Lenses are reference use cases you configure, combine and extend, not separate pre-built products.
What 7lens connects
Section titled “What 7lens connects”The key concept is that an automation is an Asset, recognized by its Asset Type and one Offering of that Service. It is described via attributes and connected to the existing 7lens Technology model. This yields a common model that lets 7lens measure the operation end to end rather than measuring automation separately from the services it supports.
- Automations
- AI agents
- Service offerings
- Services
- Technology
- Tickets and demand
- Execution metrics
Relationship chain: Ticket / Demand → Service Offering → Service / Technology → Automation → AI Agent
Tickets, automations and AI agents all map to Service Offerings, so 7lens understands demand, service, technology, automation and AI together rather than as independent systems.
The problem
Section titled “The problem”Organizations invest heavily, sometimes millions, in automation, AIOps, AI agents, self-service and operational tooling, but they struggle to demonstrate return. They know they have 500 automations but cannot easily answer: how much of our operation is actually automated? Which automations work? Which services are automated? Which demands are still manual? How fast are automated services delivered? Where are people still doing repetitive operational work? What should we automate next? What ROI are we getting? The data exists, but it is distributed across ticketing, support, operations and automation platforms.
The outcome
Section titled “The outcome”You get an overall view of the organization’s degree of automation and operational performance. Heat maps can show high-volume operations, operations with low automation, poor-performing automations, highly automated services and manual operational hotspots. This creates an automation backlog so engineering can decide what to automate traditionally, automate with AI agents, redesign or leave manual.
The value
Section titled “The value”Connect automation investment to operational performance, human effort, cost and ROI. Leadership sees whether past automation investments deliver value and where to invest next. It also provides evidence for negotiating operational contracts: if you are paying for Level 1 work that is demonstrably automated, there is evidence to challenge that cost structure and redirect people to higher-value work. The lens can demonstrate improvements in cost, automation level, operational quality, Mean Time to Recover, Mean Time to Resolve, human effort and service delivery speed. Do not just measure automation. Measure the operation, and understand what automation and AI are doing to it.
Example
Section titled “Example”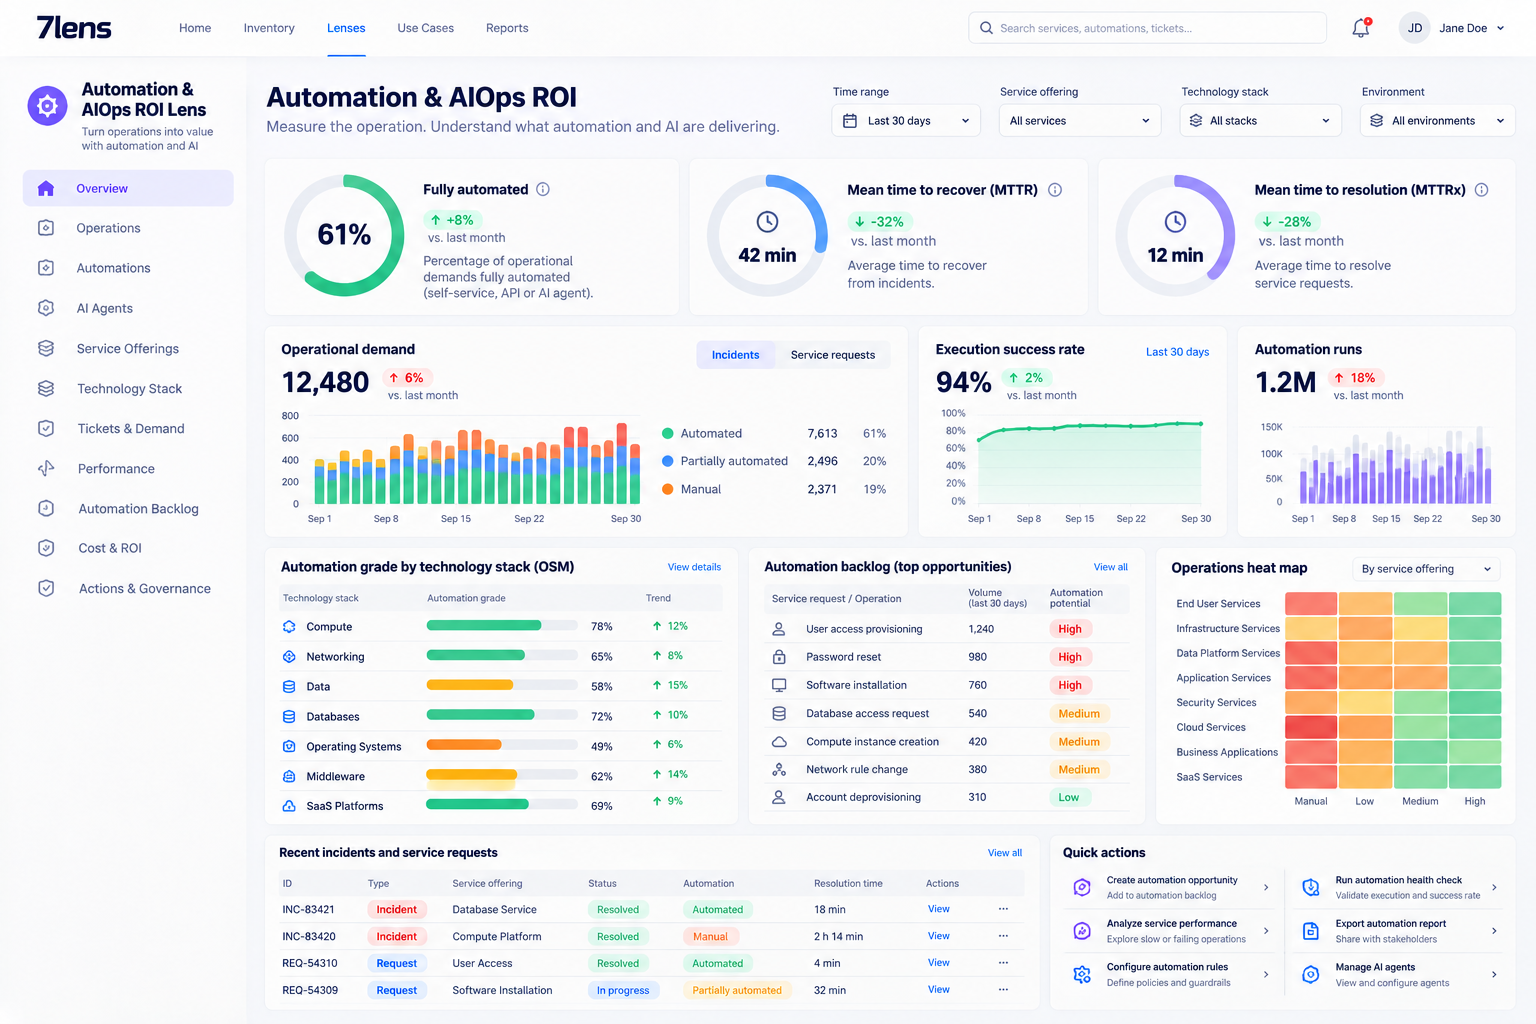
An example of what you can build within this use case.
Next steps
Section titled “Next steps”- Onboarding in under 40 hours: configure the Context every lens reads.
- Data model: the Ontology behind each lens.